Trajectory Race
980,000 Cases: How Mongolia's Covid Compared
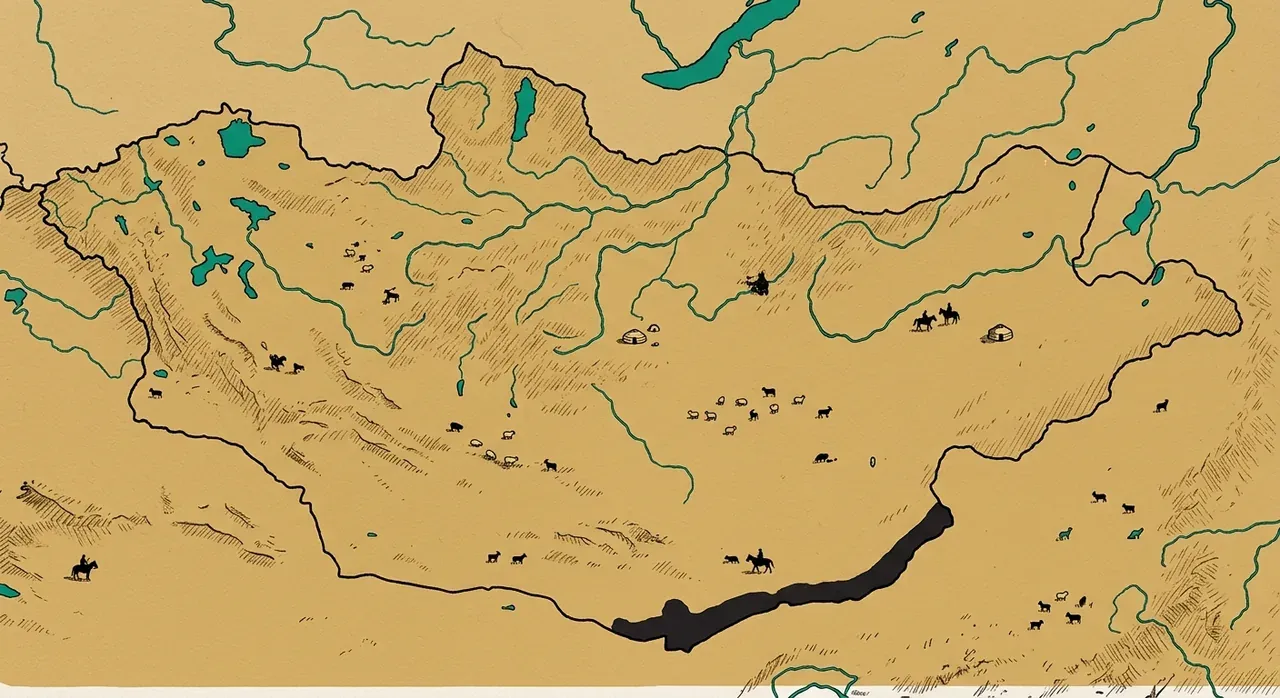
When the New York Times charted the coronavirus pandemic on a logarithmic scale, aligning countries by "days since the 100th case," something clicked. The approach stripped away calendar noise and laid bare each nation's outbreak trajectory. We apply the same lens to Mongolia — a landlocked country of 3.4 million that initially kept cases near zero, then saw an explosive wave once Omicron arrived.
The final numbers tell a striking story. Mongolia, with a population of just 3.4 million, recorded roughly 980,000 cumulative cases — about 288 per 1,000 people. South Korea's rate was nearly identical at 290 per 1,000. Despite vastly different population sizes, density, and healthcare systems, the per-capita burden landed in the same range. Meanwhile, Kazakhstan (36 per 1,000) and Russia (83 per 1,000) reported far lower rates — likely reflecting differences in testing capacity as much as actual spread.
The logarithmic trajectory chart reveals dynamics that a simple bar chart of total cases cannot. Early in a pandemic, steeper lines signal faster doubling times — and Mongolia's line, once it took off, climbed as steeply as any neighbor's. The flattening that eventually appeared in every curve marks the transition from exponential spread to saturation and policy-driven suppression.
MORE IN SOCIAL
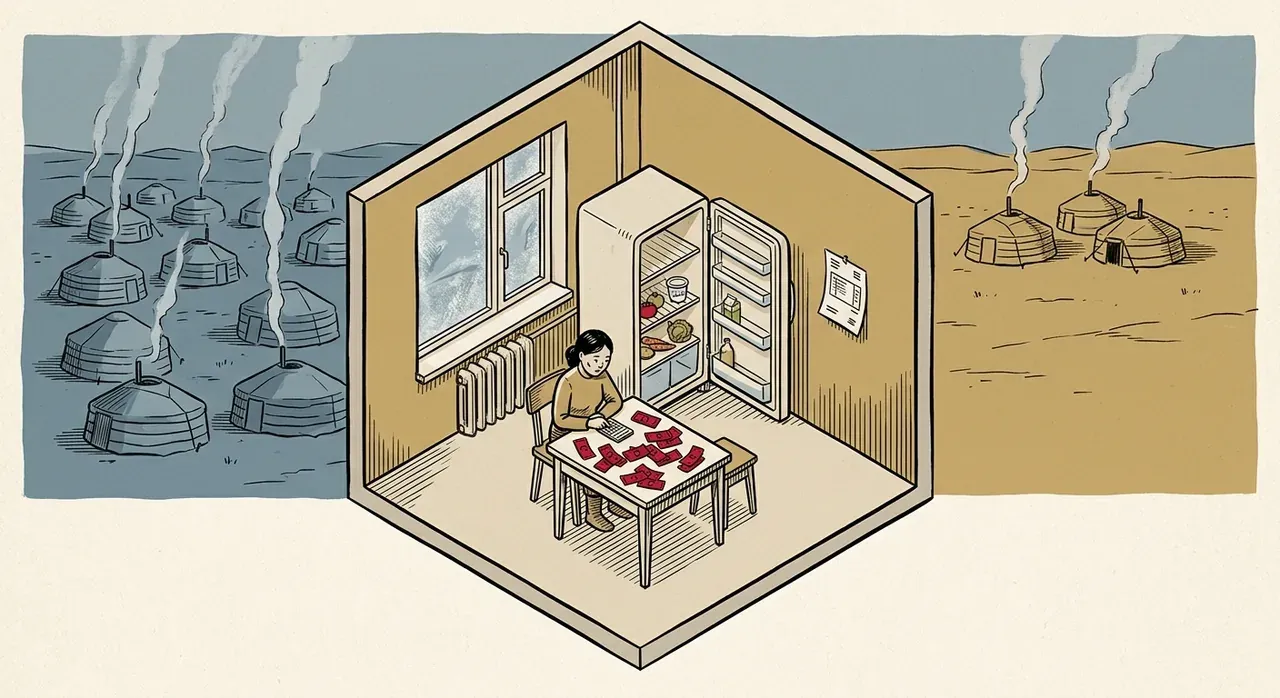
₮792,000 a Month: Can You Survive in Ulaanbaatar?

Top Schools vs. Bottom Schools: Mongolia's Education Gap
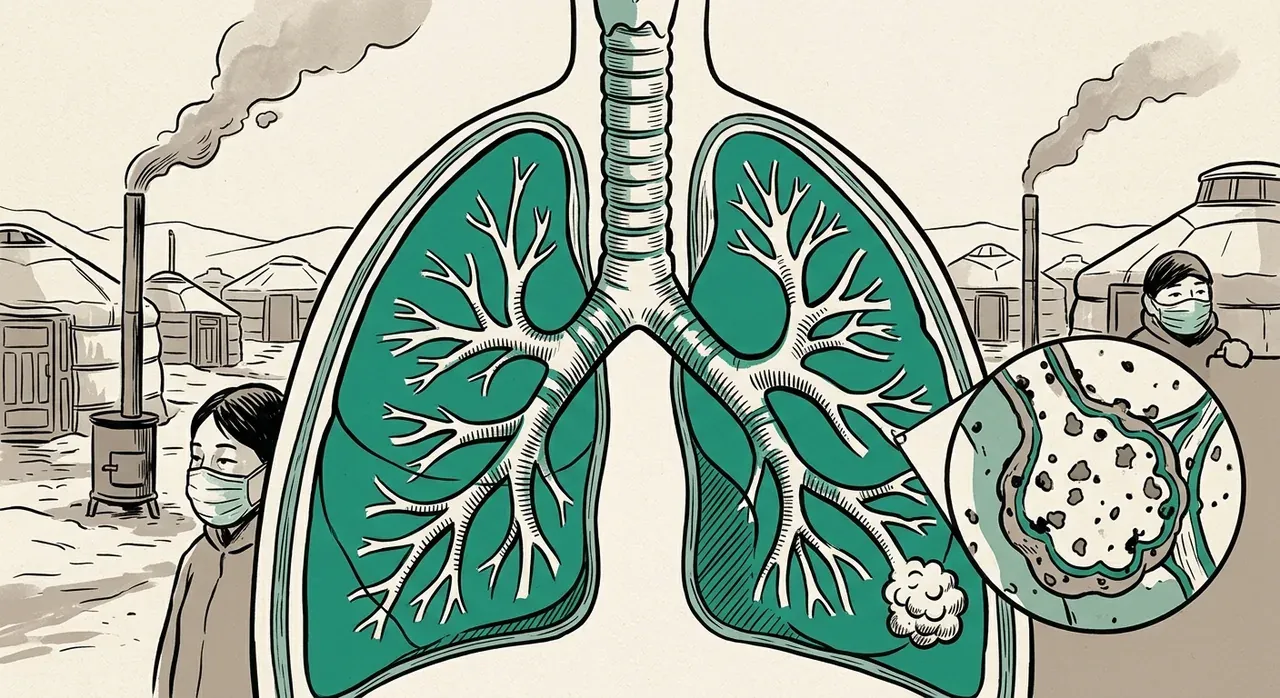
380 µg/m³ in January: How Coal Smoke Reaches Your Lungs

3 Charts, 3 Surprises: You Draw Mongolia's Future — Then See What Actually Happened

1.54 Million in One City: Mongolia's Population Imbalance