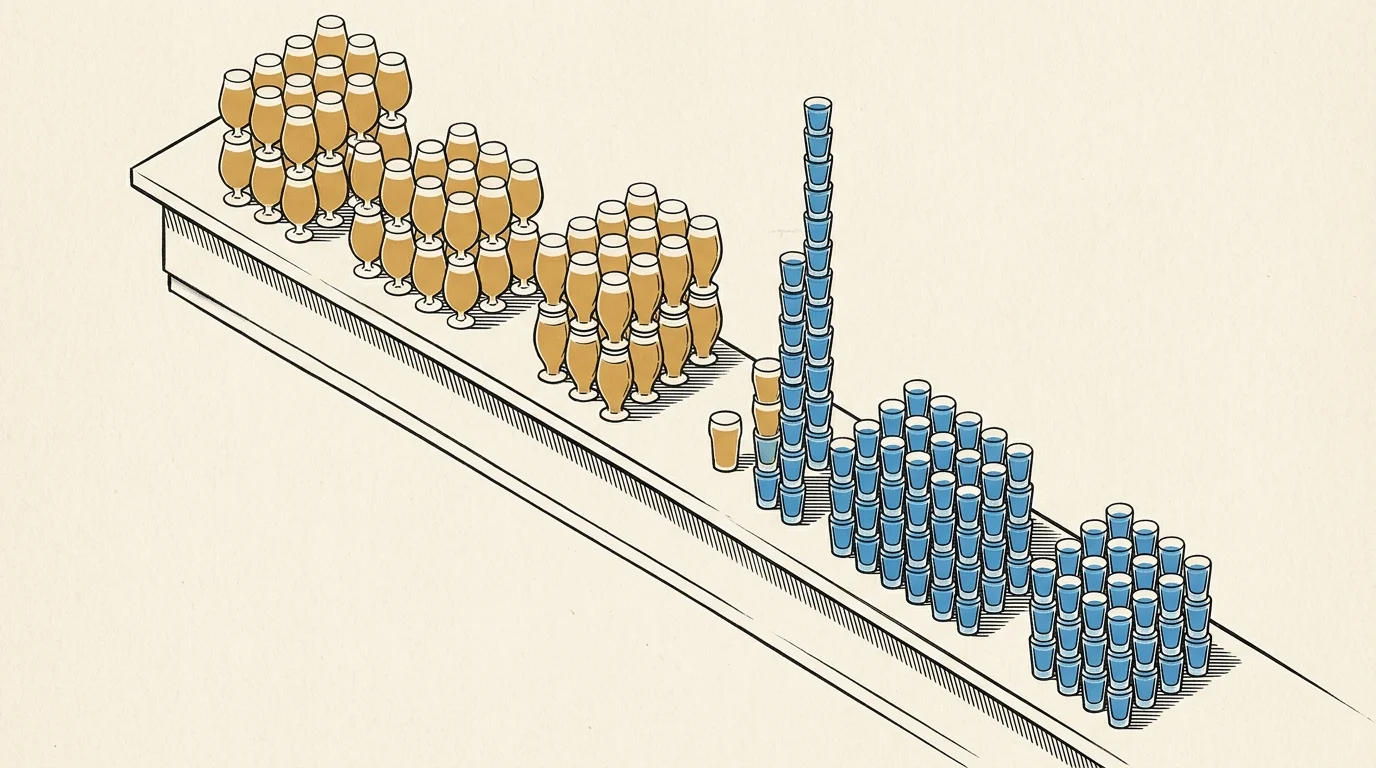
Mongolia drinks twice as much spirits as beer. Europe is the opposite. What a country drinks tells you where it is.
Mongolia's drinkers consume about 189 servings of spirits a year — vodka, primarily — against 77 servings of beer. That ratio is not a coincidence. Across Asia, spirits account for more than half of all alcohol servings. In Europe, beer and wine together dominate.
The data comes from the World Health Organization's 2014 Global Status Report on Alcohol and Health, covering consumption around 2010. FiveThirtyEight compiled it into a publicly available dataset. The numbers are estimates — the WHO acknowledges that survey quality varies by country — but the regional patterns are consistent.
Beer vs. spirits consumption by country
Servings per person per year. Each dot is one country, colored by region.
Source: WHO Global Status Report on Alcohol and Health 2014, via FiveThirtyEight
The scatter chart plots every country by its beer and spirits consumption. The regional divide is visible: European countries cluster toward more beer, Asian countries toward more spirits. Mongolia sits in the Asian cluster.
Grenada is the extreme outlier: 438 spirits servings a year, more than any other measured country. Belarus leads in total consumption at 14.4 litres of pure alcohol per person per year.
Average alcohol consumption by region
Servings per person per year, ~2010 WHO data.
Source: WHO 2014, via FiveThirtyEight
By region, Europe leads in total consumption at 8.5 litres of pure alcohol per person per year. The Americas follow at 6.1 litres, nearly evenly split between beer and spirits. Africa averages 3.0 litres, Asia 2.4 litres.
Mongolia at 4.9 litres sits above the Asian regional average — higher consumption than the typical Asian country but well below Europe.
Top 20 countries by total alcohol consumption
Litres of pure alcohol per person per year, ~2010.
Source: WHO 2014, via FiveThirtyEight
A note on this data. These are WHO estimates from approximately 2010, published 2014. Consumption patterns have changed in the 16 years since. Individual country figures carry larger uncertainty ranges than single numbers suggest. Treat them as regional indicators, not precise measurements.
MORE IN SOCIAL
380 µg/m³ in January: How Coal Smoke Reaches Your Lungs
980,000 Cases: How Mongolia's Covid Compared
Nomad vs. City: Which Life Scores Higher?
Top Schools vs. Bottom Schools: Mongolia's Education Gap
21 Aimags: Which One Should You Live In?